Market Recap #38: How to Build a Futures Day Trading Setup (+ My Strategy)
US Manufacturing Slides; Retail Sales Stable; Housing Dip; Components of a S&P Futures Strategy; Key Learning - Less Talk, More Action.
Welcome to this week’s Market Recap!
The purpose of the Market Recap is to: 1) inform; and 2) prepare. Financial markets can be overwhelming, so knowing where we are, and where we might be going is the precursor to making better financial decisions.
Feel free to subscribe, I’ll be posting every week and Substack posts directly to your email so it’s pretty convenient.
In this week’s recap we’ll cover:
Economic Recap
Components of a S&P Futures Strategy
Equity and Bond Market Review
US Equity Sector Returns
The Week Ahead
Key Learning this Week
Economic Recap
US
Manufacturing
Manufacturing continued to decline, aligning to the PMI’s findings last week. We’ve seen some bounce in future business expectations but I wouldn’t hang my coat on it, never mind a portion of my portfolio.
Interestingly, insights on labour from the report support a strong labour market with employment steady and wages rising. In terms of market narratives, this is important in the Fed’s grand plan for a soft landing. As long as inflation continues to fall, this is positive for markets.
Empire State Manufacturing Index
General business conditions index fell to 1.1
Input and selling price increases continued to moderate.
Planned increases in capital spending remained weak
The index for future business conditions also fell indicating a muted optimism on H2
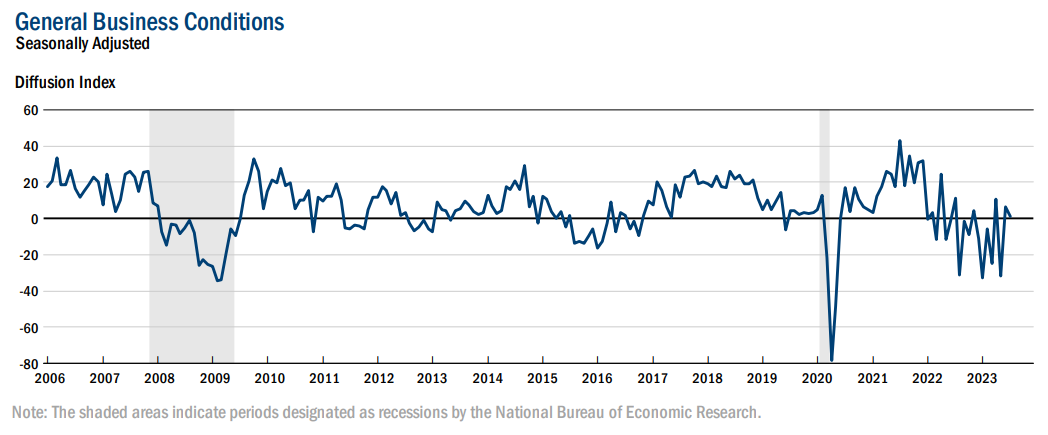
Source: Federal Reserve Bank of New York
Philly Fed Manufacturing Index
General activity and new orders remained negative
Future indicators improved, suggesting more widespread expectations for overall growth over the next six months
Firms continued to expect increases in employment over the next six months
58% of the firms indicated wages and compensation costs had increased over the past three months
30% noted they are planning to increase wages and compensation by more than originally planned
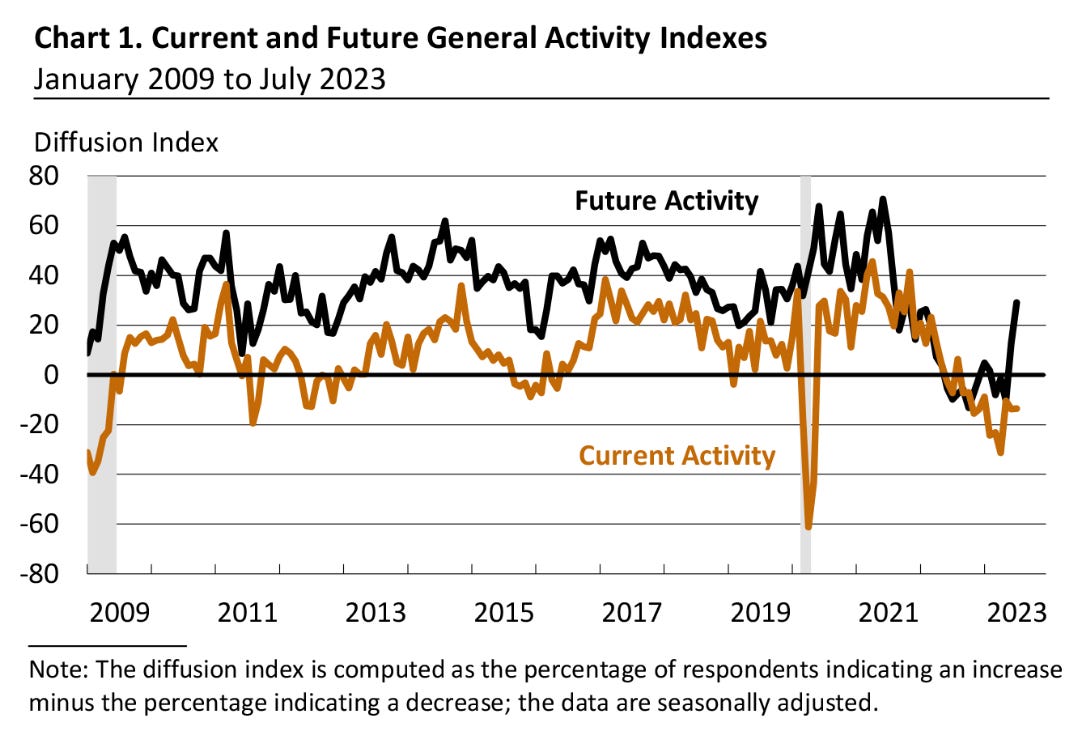
Source: Federal Reserve Bank of Philadelphia
Retail Sales
US retail sales is a coincident indicator, not a leading indicator so we review it to know where we are, not where we’re going. Given we’re long the US consumer, it’s important to keep our finger on the pulse and retail sales is a good way to do that. Overall we’re still growing but slightly below expectations.
Overview
Retail sales increase 0.2% in June (below expectations 0.5%)
Core retail sales rise 0.5% (below expectations 0.4%)
Key Points
Receipts at service stations and building material stores declined
Online sales were up 1.9%, the most in six months
Receipts at furniture stores increased 1.4%
Electronics and appliance store sales advanced 1.1%
Clothing store sales rose 0.6%
Grocery store sales fell as did receipts at department stores
Source: US Census Bureau, Reuters
Housing (June)
Housing starts and building permits dipped this month but I don’t think it’s a concern. It seems like we’re stabilising and showing reasonable resilience in a +7% mortgage environment.
We anticipated this in our housing trade, which is why we were long on XHB (US Homebuilders ETF) given the demand in housing, builder sentiment and shortage of builder materials. We’re up 20% on that trade over the last 2 months.
Housing Starts
Privately‐owned housing starts fell 8.1%
Single-family housing starts drop 7.0%
Multi-family starts fall 11.6%
Building Permits
Single-family building permits increase 2.2%
12 month high: shortage of previously owned houses for sale supports new construction.
Multi-family permits drop 5.6%
Source: US Census Bureau, Reuters
UK
CPI
A step in the right direction this week for the UK as a recent 50bp increase negatively surprised markets. However, reviewing the FTSE100 chart this week, actually I think it’s in good shape for growth. More on this next week!
CPI rose by 7.9% in June, down from 8.7% in May
Falling prices for motor fuel led to the largest downward contribution
Food prices rose in June but by less than in June 2022
Core CPI (excluding energy, food, alcohol and tobacco) rose by 6.9%, down from 7.1% in May
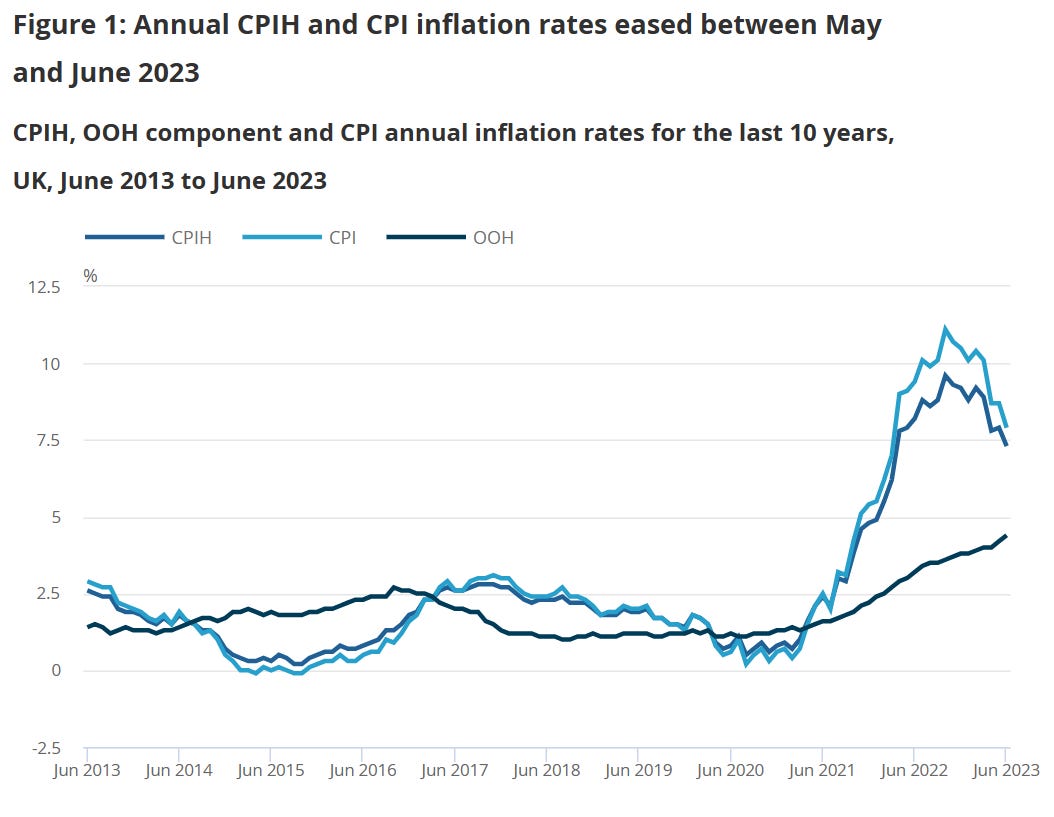
Source: Office for National Statistics
Components of a S&P Futures Strategy
This week I went live with the S&P Futures trading strategy that I’ve been backtesting for the last 2 - 3 months. I’m up 3.5% this week on 4 trades, 2 winners and 2 loser.
Before you snub me and my 3.5%, each trade has a maximum risk of 1%. Anyone can close there eyes and blindly make 3.5%. But can you make 3.5%, with a maximum risk in each trade of 1% - that’s the challenge!
So, let’s run through the core components of any futures trade setup.
Core Concepts
Higher Timeframe Bias
I believe that bigger market players can prop up markets when they want to sell, and drive down markets when they want to buy. For example, when George Soros famously was long copper, he didn’t just buy copper, he artificially pushed the price of copper lower and then bought it.
Higher timeframe bias is similar to him actually wanting to buy copper, i.e., what does the market actually want to do? Go up or down?
Once you confirm your higher timeframe bias, everything else is just manipulation.
So if the market is bullish, but price is trading lower, the view based on your higher timeframe bias should be - “the only reason we’re going down, is to go up”.
Once we establish what direction we think price will move in, and we see some movement in an area of interest (AOI), we’re ready to drop into our lower timeframe entry model.
Note: Higher timeframes just implies higher timeframes than you use for execution. For me that’s mainly: Weekly / Daily / 4 Hour / 1 Hour
Time
Markets behave in different ways at different times.
The main timezones or “killzones” as they’re sometimes referred to in trading are (all in NY time):
London Session: 2am to 5am
New York AM Session: 8am to 11am
New York PM Session: 1pm to close (5pm)
Asia: 8pm to 11:30 pm
Your setup should be in one of these timezones for higher edge because that’s where the highest volume will be. Depending on the underlying asset, one killzone may be more appropriate than another. For example, major indices like the S&P 500 move better in the New York AM and PM sessions.
Lower Timeframe Entry
Armed with your higher timeframe bias in the correct killzone, now it’s time to look for your lower timeframe entry model:
How do you know when the true market narrative is about to playout?
What does price need to do?
In what area / range?
What exact price do we need to go to before you enter?
Risk
How much capital are you willing to risk on this trade?
Targeting
What are you aiming at?
Are you taking partial profits
Are you leaving runners?
Applying the Core Concepts: My Futures Trading Strategy
Higher Timeframe Bias
I establish my higher timeframe bias using:
Market Structure
Liquidity
Areas of Interest
Order blocks
Fair value gaps
Order Flow
(Happy to discuss all of these in depth again if there’s demand for it!)
Time
I use this setup in the New York PM session (1pm to close)
Lower Timeframe Entry
Price to take 1 hour / 15 min liquidity into an “Area of Interest”
5 min Break of Structure
1 min Break of Structure in a discount “Area of Interest” within the 5 min range
Enter on the candle after a close below a 1 min low
Risk
1%
Targeting
Recent lows
Higher timeframe lows for runners
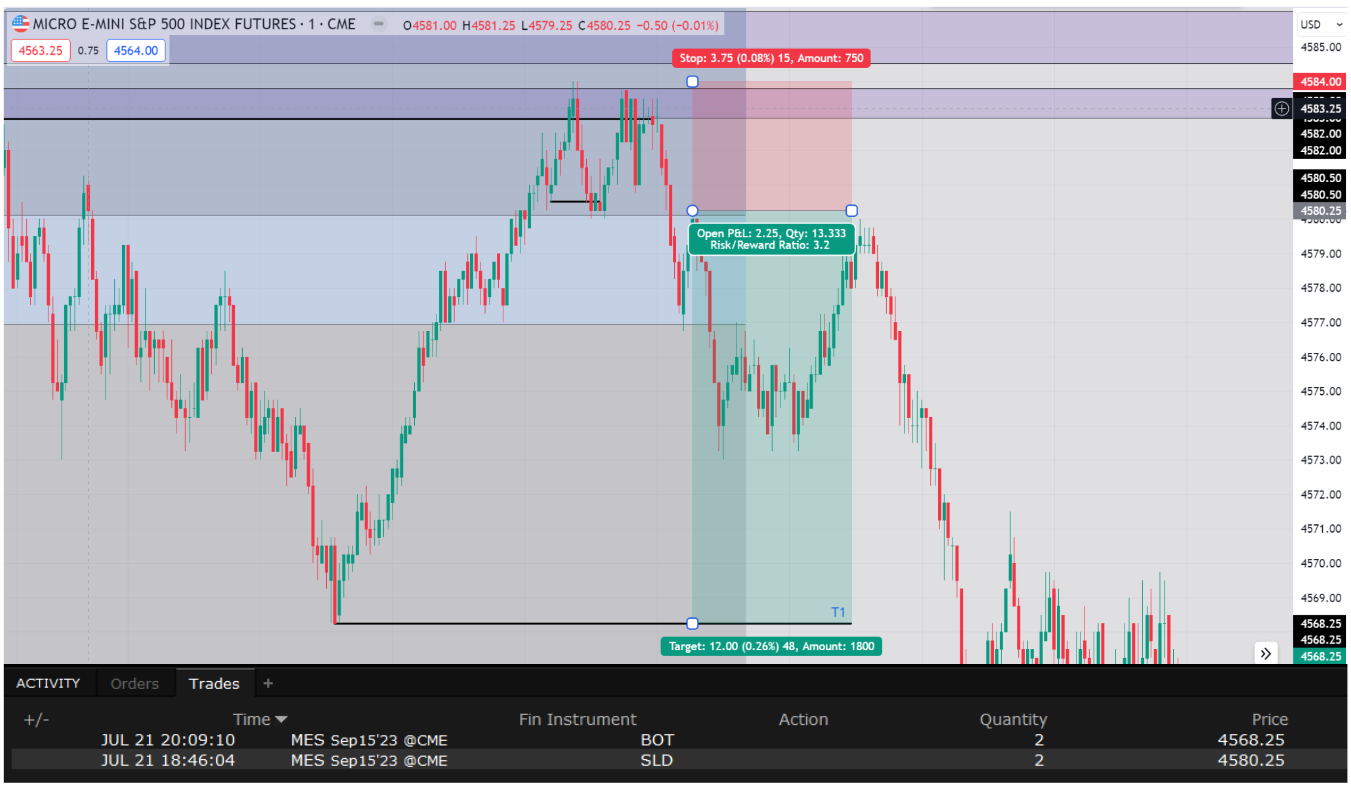
My Futures Trading Strategy - in Action
My higher timeframe bias yesterday was bearish. I’m not going to run through my process for establishing bias in this newsletter given it would need it’s own section. But I went through it, and decided I thought we were going lower.
The below is the 5 min price action from last night’s New York PM session.
As we can see, we got our 5 minute break of structure (black line highlighted in blue), so we’re now on for our setup. The purple boxes are gaps in price I’ve highlighted in the 5 min range. These are AOIs that I want price to trade into before I enter for higher probability setups.
We can see price actually broke down in the middle of the range which I didn’t enter on because it didn’t hit my area of interest. We then see price enter into the purple box so now I’m dropping into a 1 min chart to see if I get my trigger to enter!
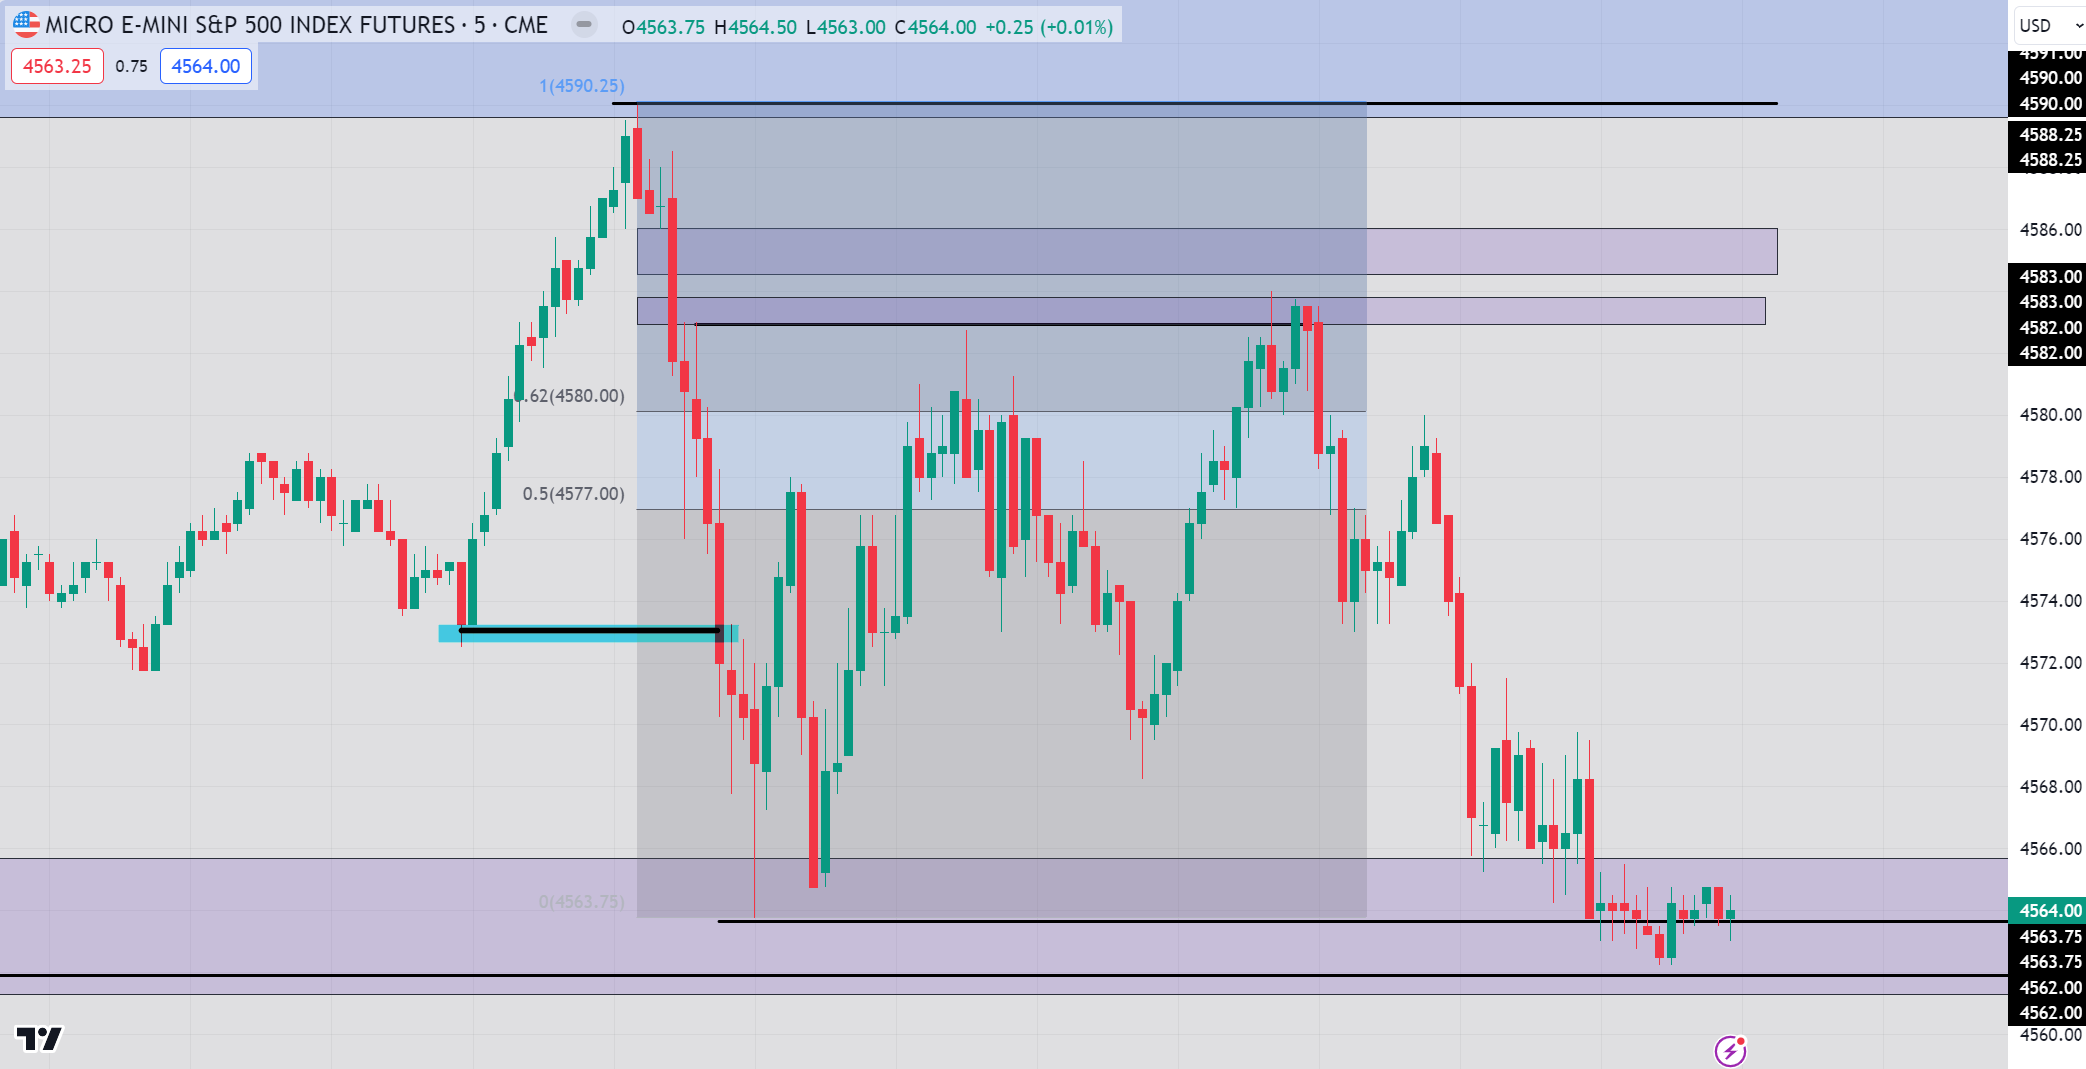
On the 1 min below, the black line denotes our 1 min entry model.
We had a close below the last low and as such I entered on a market order on the next candle. I was very nearly stopped out but ultimately closed the full trade at 3.2R hitting my first profit target (bottom of the green area). I usually leave runners but decided to close out fully last night.
So that’s it!
That is literally what I’ll be doing from 6pm to 9pm everyday until it stops working!
Equity and Bond Market Review:
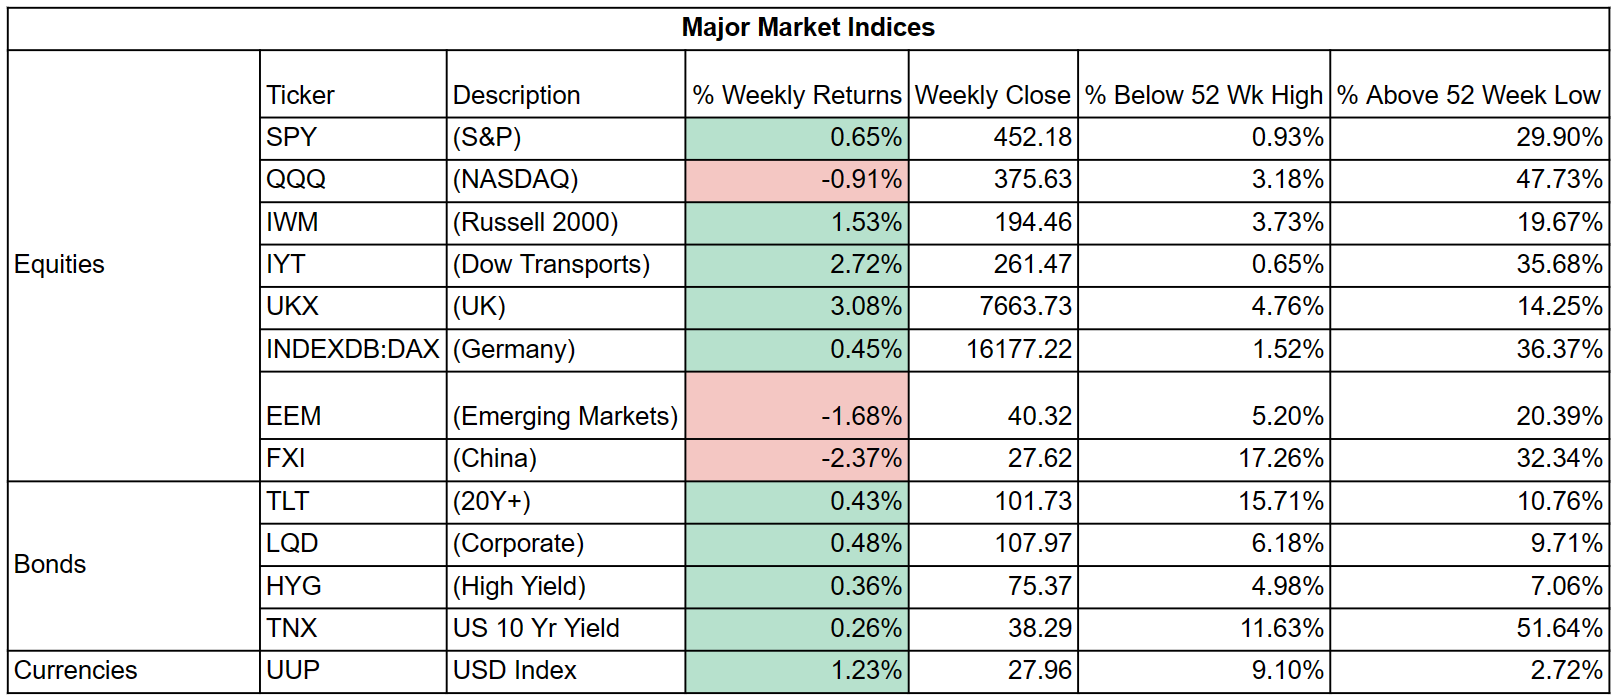
US equities stayed green this week despite some early signs we’ll be trading lower next week. UK and Europe lead the global gains while bonds were relatively flat.
Equity Sector Returns
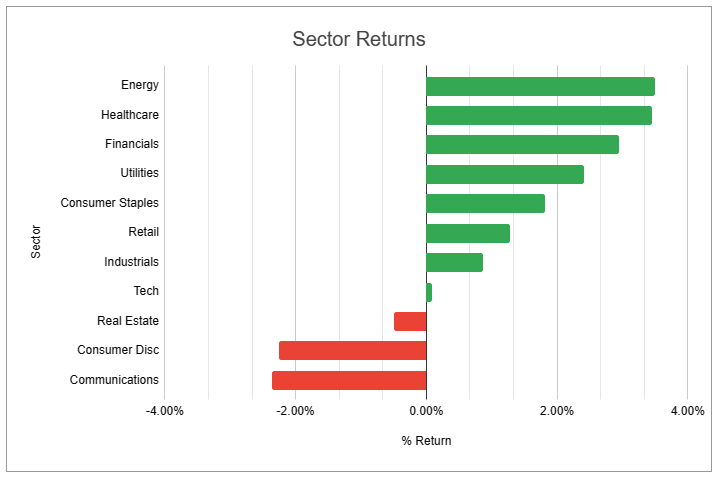
Energy was up this week, followed closely by healthcare and and financials. Communications, consumer discretionary and real estate lead the declines.
The Week Ahead
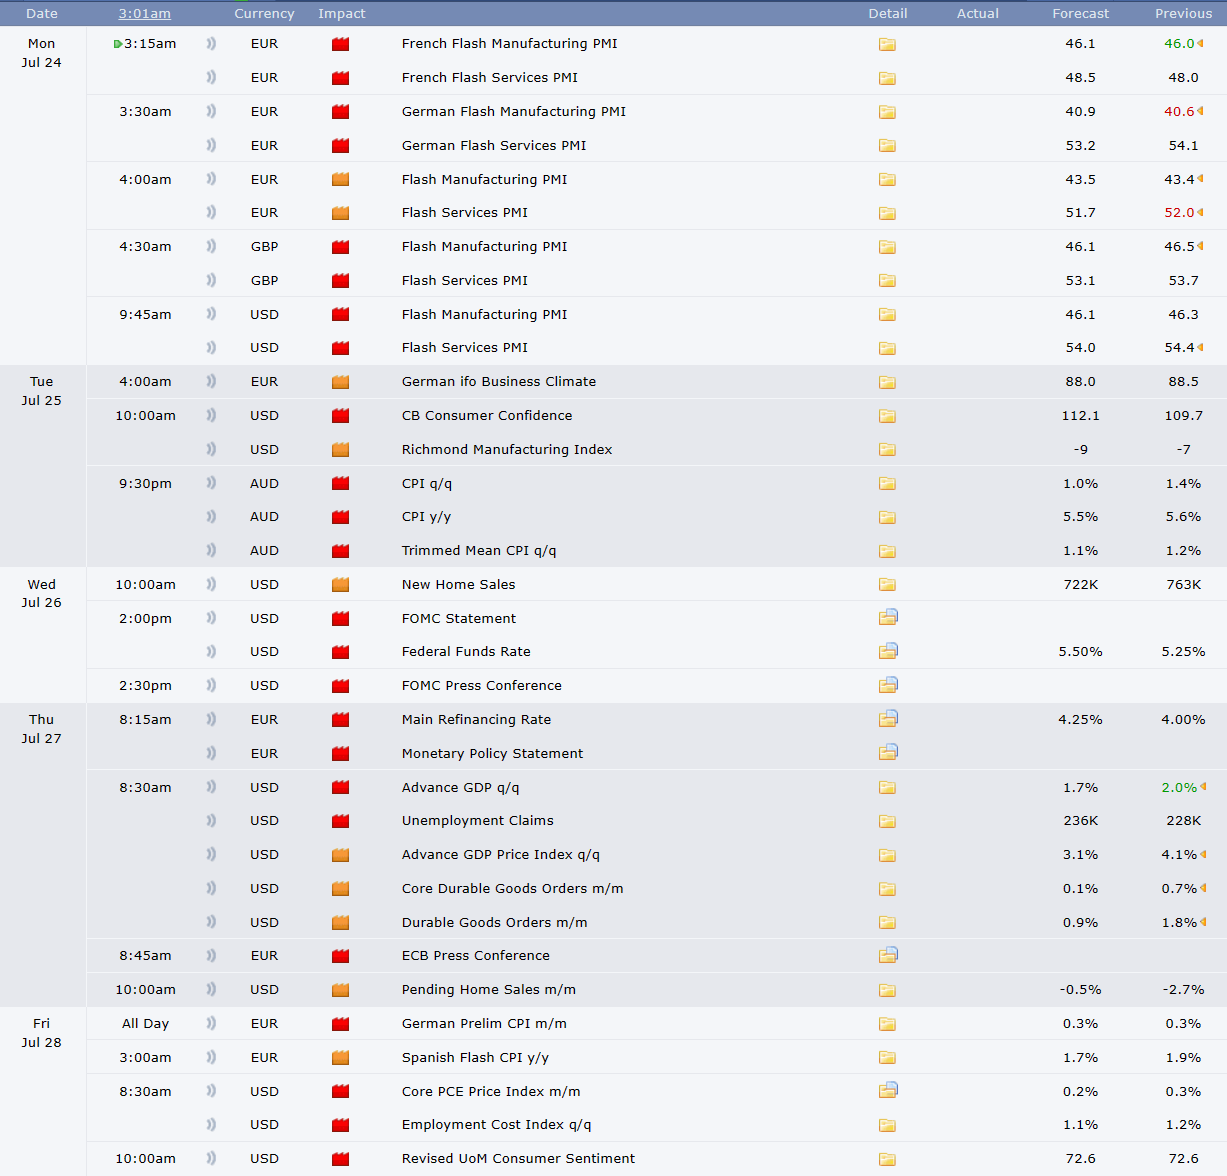
Source: Forex Factory
Key Learning this Week: Less Talk, More Action
I find the brain can be a tricky beast at times.
It craves certain chemicals and when it gets them it’s happy but because chemicals in the brain can be derived in so many ways, it doesn’t objectively mean you’ve achieved anything.
For example, I was talking about trying a funded challenge with my trade setup, whereby you get 150K to trade with if you pass. I fantasized about all the money I would make with my 2 - 3% goal per week. My brain got a sense of achievement and excitement from those thoughts and the positive feedback from others that I told my plan to.
Brain feels great.
Objectively have achieved nothing.
Show people your goals after you’ve achieved them.
Less talk, more action.
Happy Saturday - have a great weekend!