The Trading Playbook of a Potential Market Wizard
How Stephen Hoad creates, refines and implements trading strategies
Welcome back!!
Stephen Hoad is amongst the best traders I’ve met.
He’s somewhere between a man and a money printer.
Having worked in some top financial institutions and investment banks, Stephen has pretty much seen it all.
And like many successful traders, he’s come up with a unique he to trading that he’s mastered and combined it with his probabilistic mindset and outlook to create an edge.
I sat down with Stephen for a hands-on, practical session on how to build an edge.
Here are my detailed notes from the episode.
How Stephen Creates an Edge
1. Probabilistic Thinking at the Core
Stephen describes himself as a “probabilistic trader”—thinking like a poker player assessing odds.
He starts every strategy with the core question: “Do I have an edge?”
His trading style is about tilting the probabilities using structured models and data, not prediction.
2. Mental Models & Strategy Development
Strategies start as mental models or ideas, refined into systematic setups.
Built using a mix of:
Quantitative backtesting
Qualitative insights
Real-world market structure knowledge
Heavy emphasis on testing ideas to death, optimizing them, and constantly monitoring for performance decay.
3. Automation to Remove Human Bias
Uses Python and systematic coding to strip out emotional decisions.
Believes that even after decades of trading, human error still sneaks in—so systems help keep execution clean.
Why Renko Charts?
1. Origin & Discovery
Discovered Renko while working for a Japanese investment bank in the 90s.
Originally dismissed them as messy but learned from Japanese colleagues that these charts were designed to remove market noise.
2. Clarity Over Candlesticks
Renko blocks are created purely by price movement, not time.
This strips out intraday noise and allows clearer trend identification—ideal for discretionary and systematic strategies.
Example: Traders don’t get shaken out by P&L fluctuations or temporary volatility spikes.
3. Adding Time Back In
Traditionally, Renko is timeless. But Stephen reintroduced time to combine the best of both worlds.
This allowed him to:
Overlay Western indicators (e.g., moving averages, stochastics)
Avoid reliance on classic candlestick patterns
Achieve a quant-friendly, trend-centric charting environment
Strategy Construction
1. Select Block Size
Crucial to match block size to:
Volatility of the asset
Market structure (FX ≠ Stocks)
Strategy timeframe (scalping vs swing)
E.g., ATR-based sizing or volatility % works best.
Emphasizes using consistent block-sizing logic across markets to avoid overfitting.
2. Layer Western Indicators
Stochastic (5,3,3) used as a signal generator. Entry: %K > %D, Exit: drop below 80 line.
200 MA as a long-term filter: only go long above it.
10 MA as a trade management tool (e.g., exit when price crosses below it).
Donchian channel (with offset) for breakout confirmation — a unique twist that creates edge only on Renko.
🔁 He uses these combinations as modular sub-strategies:
MA + Stochastics
MA + Donchian breakout
All three combined (as in the Palantir example)
Palantir Trade Example
Asset: Palantir stock – strong 2025 performer.
Setup:
ATR-based Renko block size to match stock volatility
Stochastic crossover in oversold zone
Price above 200 and 10 MA
Donchian breakout offset line confirmation
Execution:
Entered when all conditions aligned.
Exited when price reverted through moving average or stochastic fell below 80.
Emphasized not worrying about individual RR, but instead trusting system-level expectancy.
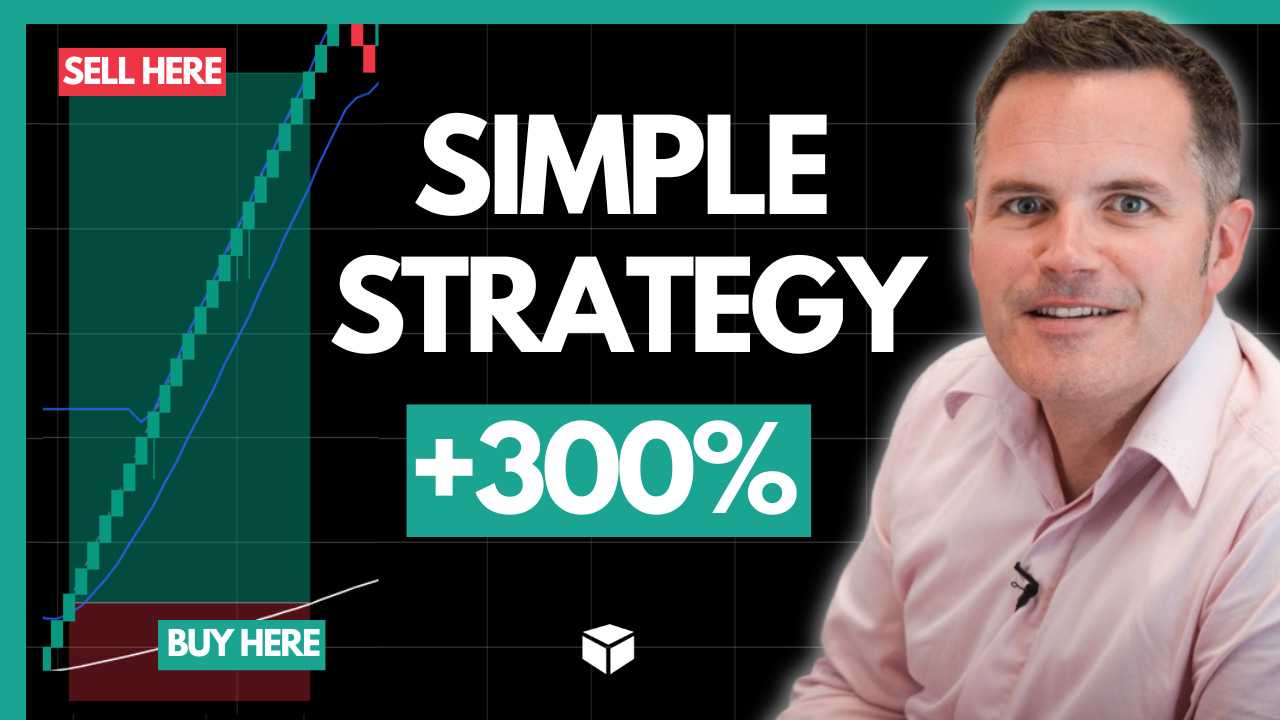
The 300% Strategy — Backtested
Origin:
Created in response to skeptics who dismissed Renko as “rubbish”.
Live-tested it for a year and returned +279%.
Retained for personal use after a hedge fund underbid for licensing.
Performance Metrics (Year 1):
✅ 1,000 trades
✅ 89% win rate
✅ Avg RR: 0.2:1
✅ Max drawdown: ~15%
✅ Avg monthly return: 10%
✅ Best month: +29%
✅ Worst month: –8%
✅ Sharpe ratios: 3–6 depending on variation
Key Lessons:
Edge does not require big winners. High win rate with small RR can work if backtested and monitored.
Monitors value at risk (VaR), Sharpe ratios, and monthly trade performance for consistency.
Tracks deviations from expected P&L in real-time.
Bulletproofing Your Strategy
1. Colinearity in Technical Analysis
Avoid using indicators based on the same input (e.g., all price-based).
Instead, use uncorrelated tools to validate signals (e.g., VIX for S&P, CoT for commodities).
2. Portfolio Optimization
Combines 10+ asset strategies for smooth P&L equity curve.
Removes dependence on one instrument or timeframe.
Optimizes around minimizing drawdown, maximizing Sharpe.
3. On Overfitting & Curve Fitting
Never over-engineers a system for one asset.
Tests if a strategy works on commodities, indices, FX, and crypto with consistent logic.
Final Thoughts From Stephen
Trading is a business, not a hobby. Treat it with the same rigor as running a company.
Ego is the enemy. Be humble. Always be learning.
TikTok glam traders won’t last 10 years—real edge comes from clarity, simplicity, and testing.
His book, “Renko Chart Trading Revolution”, covers everything discussed: edge discovery, strategy design, optimization, and automation.
Hope you enjoyed this newsletter, see you next week!
(This newsletter is not investment advice, all views are my own.)

